Spatial Analysis of Small Overwater Structures in Puget Sound
In 2025, I was contracted by Puget Sound Restoration Fund to provide spatial analytical support to a collaborative project with Washington Department of Fish and Wildlife examining the impacts of small overwater structures (SOWs) on salmon and kelp in Puget Sound. I created a custom scripted geoprocessing workflow that summarizes statistics on SOWS sizing and dispersion within variable spatial units, generated new summary datasets, and provided a full technical report as supporting documentation. Some figures from the report are included below. The workflow I created is customizable to varying spatial units to support flexible analyses, and the resulting datasets was analyzed and summarized in the full report.
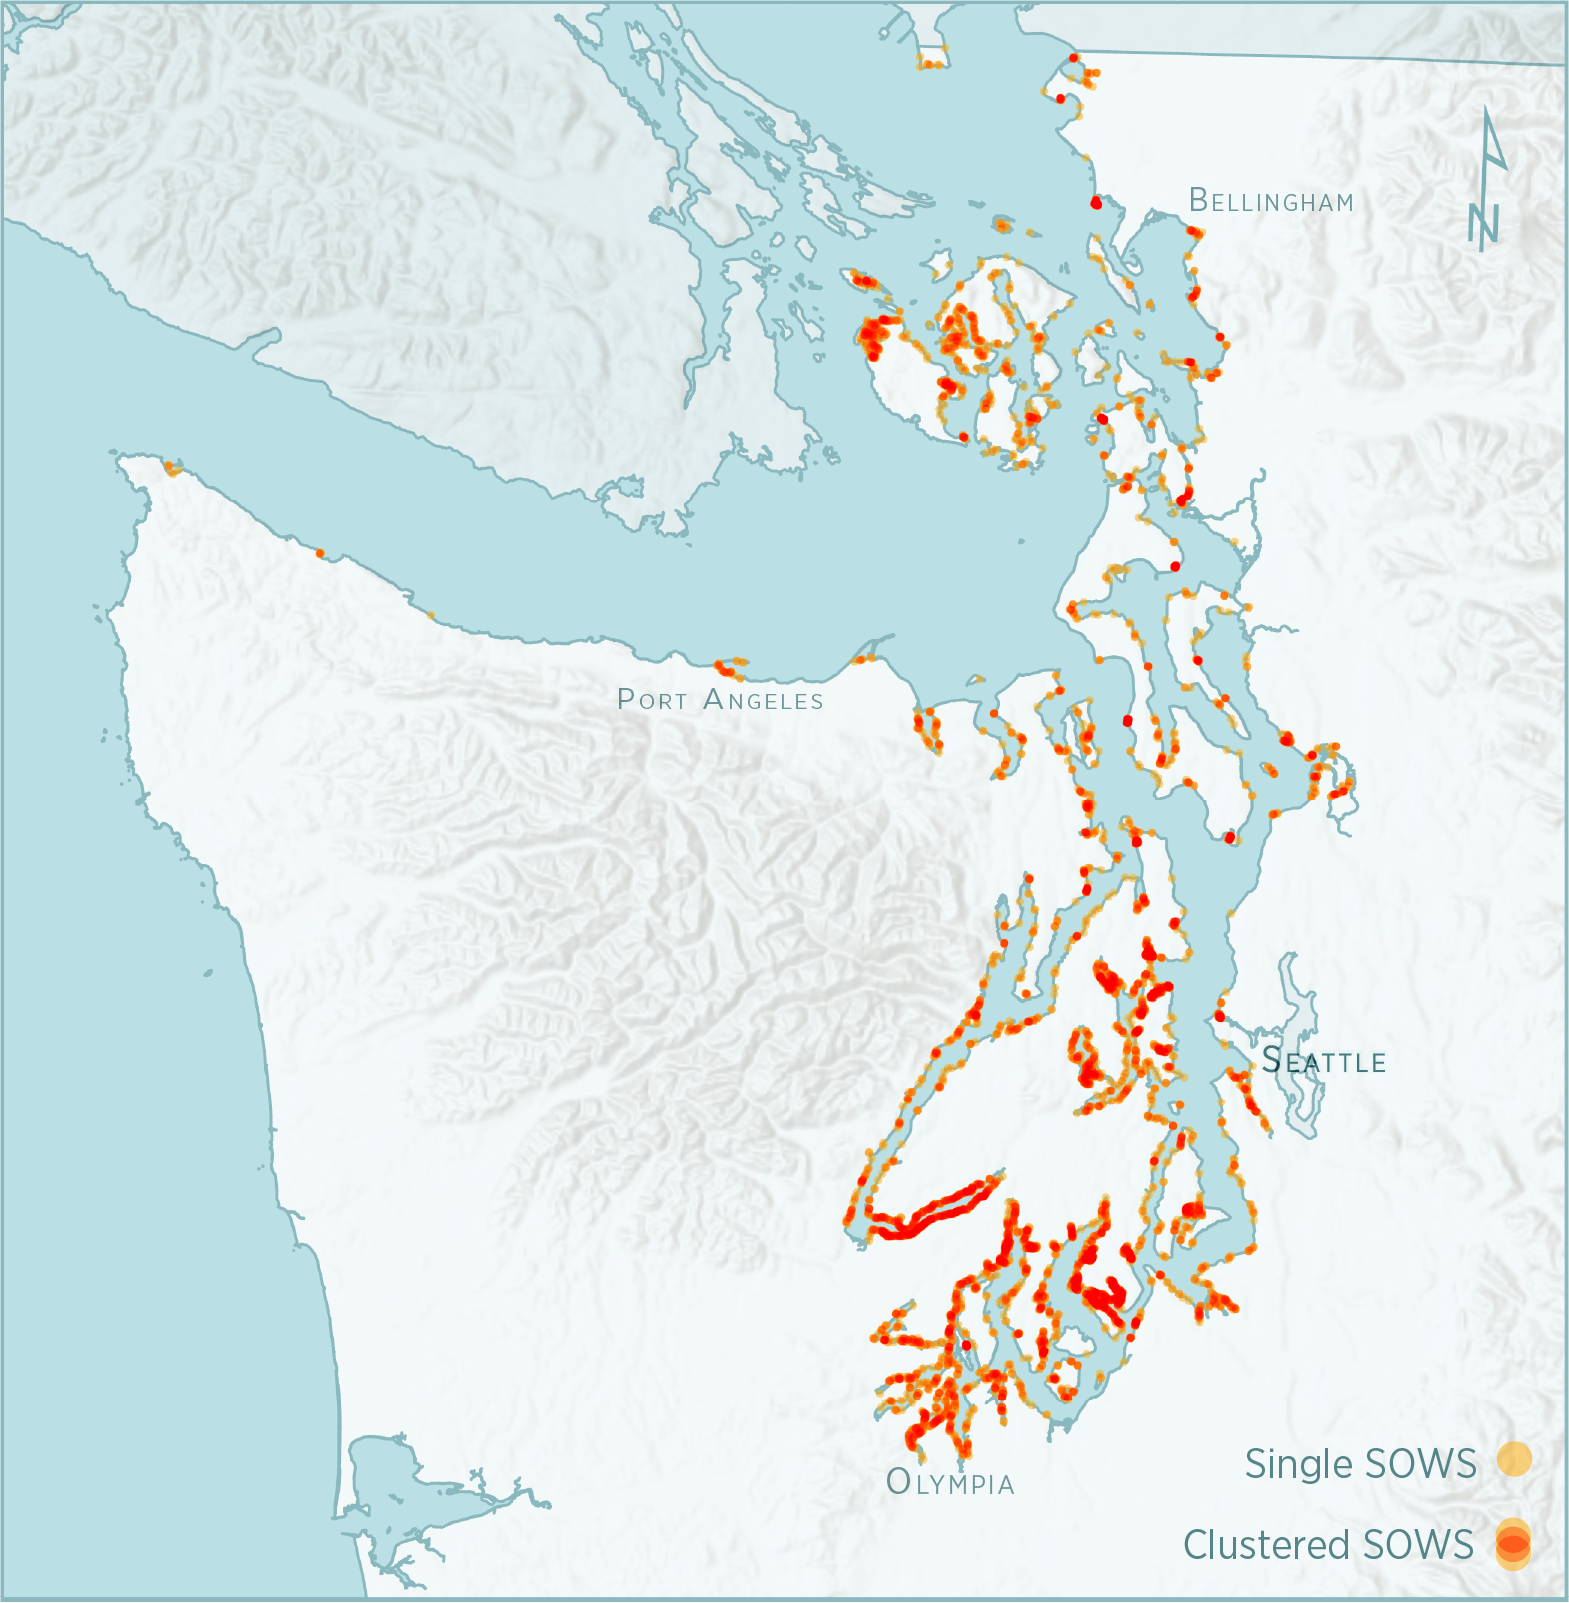
Map of Small Overwater Structures (SOWS) in Puget Sound based on filtering the NOAA Overwater Structures Dataset. Individual SOWS centroids are shown as orange dots, overlapping orange dots, indicating a higher density of SOWS, are shown in red.
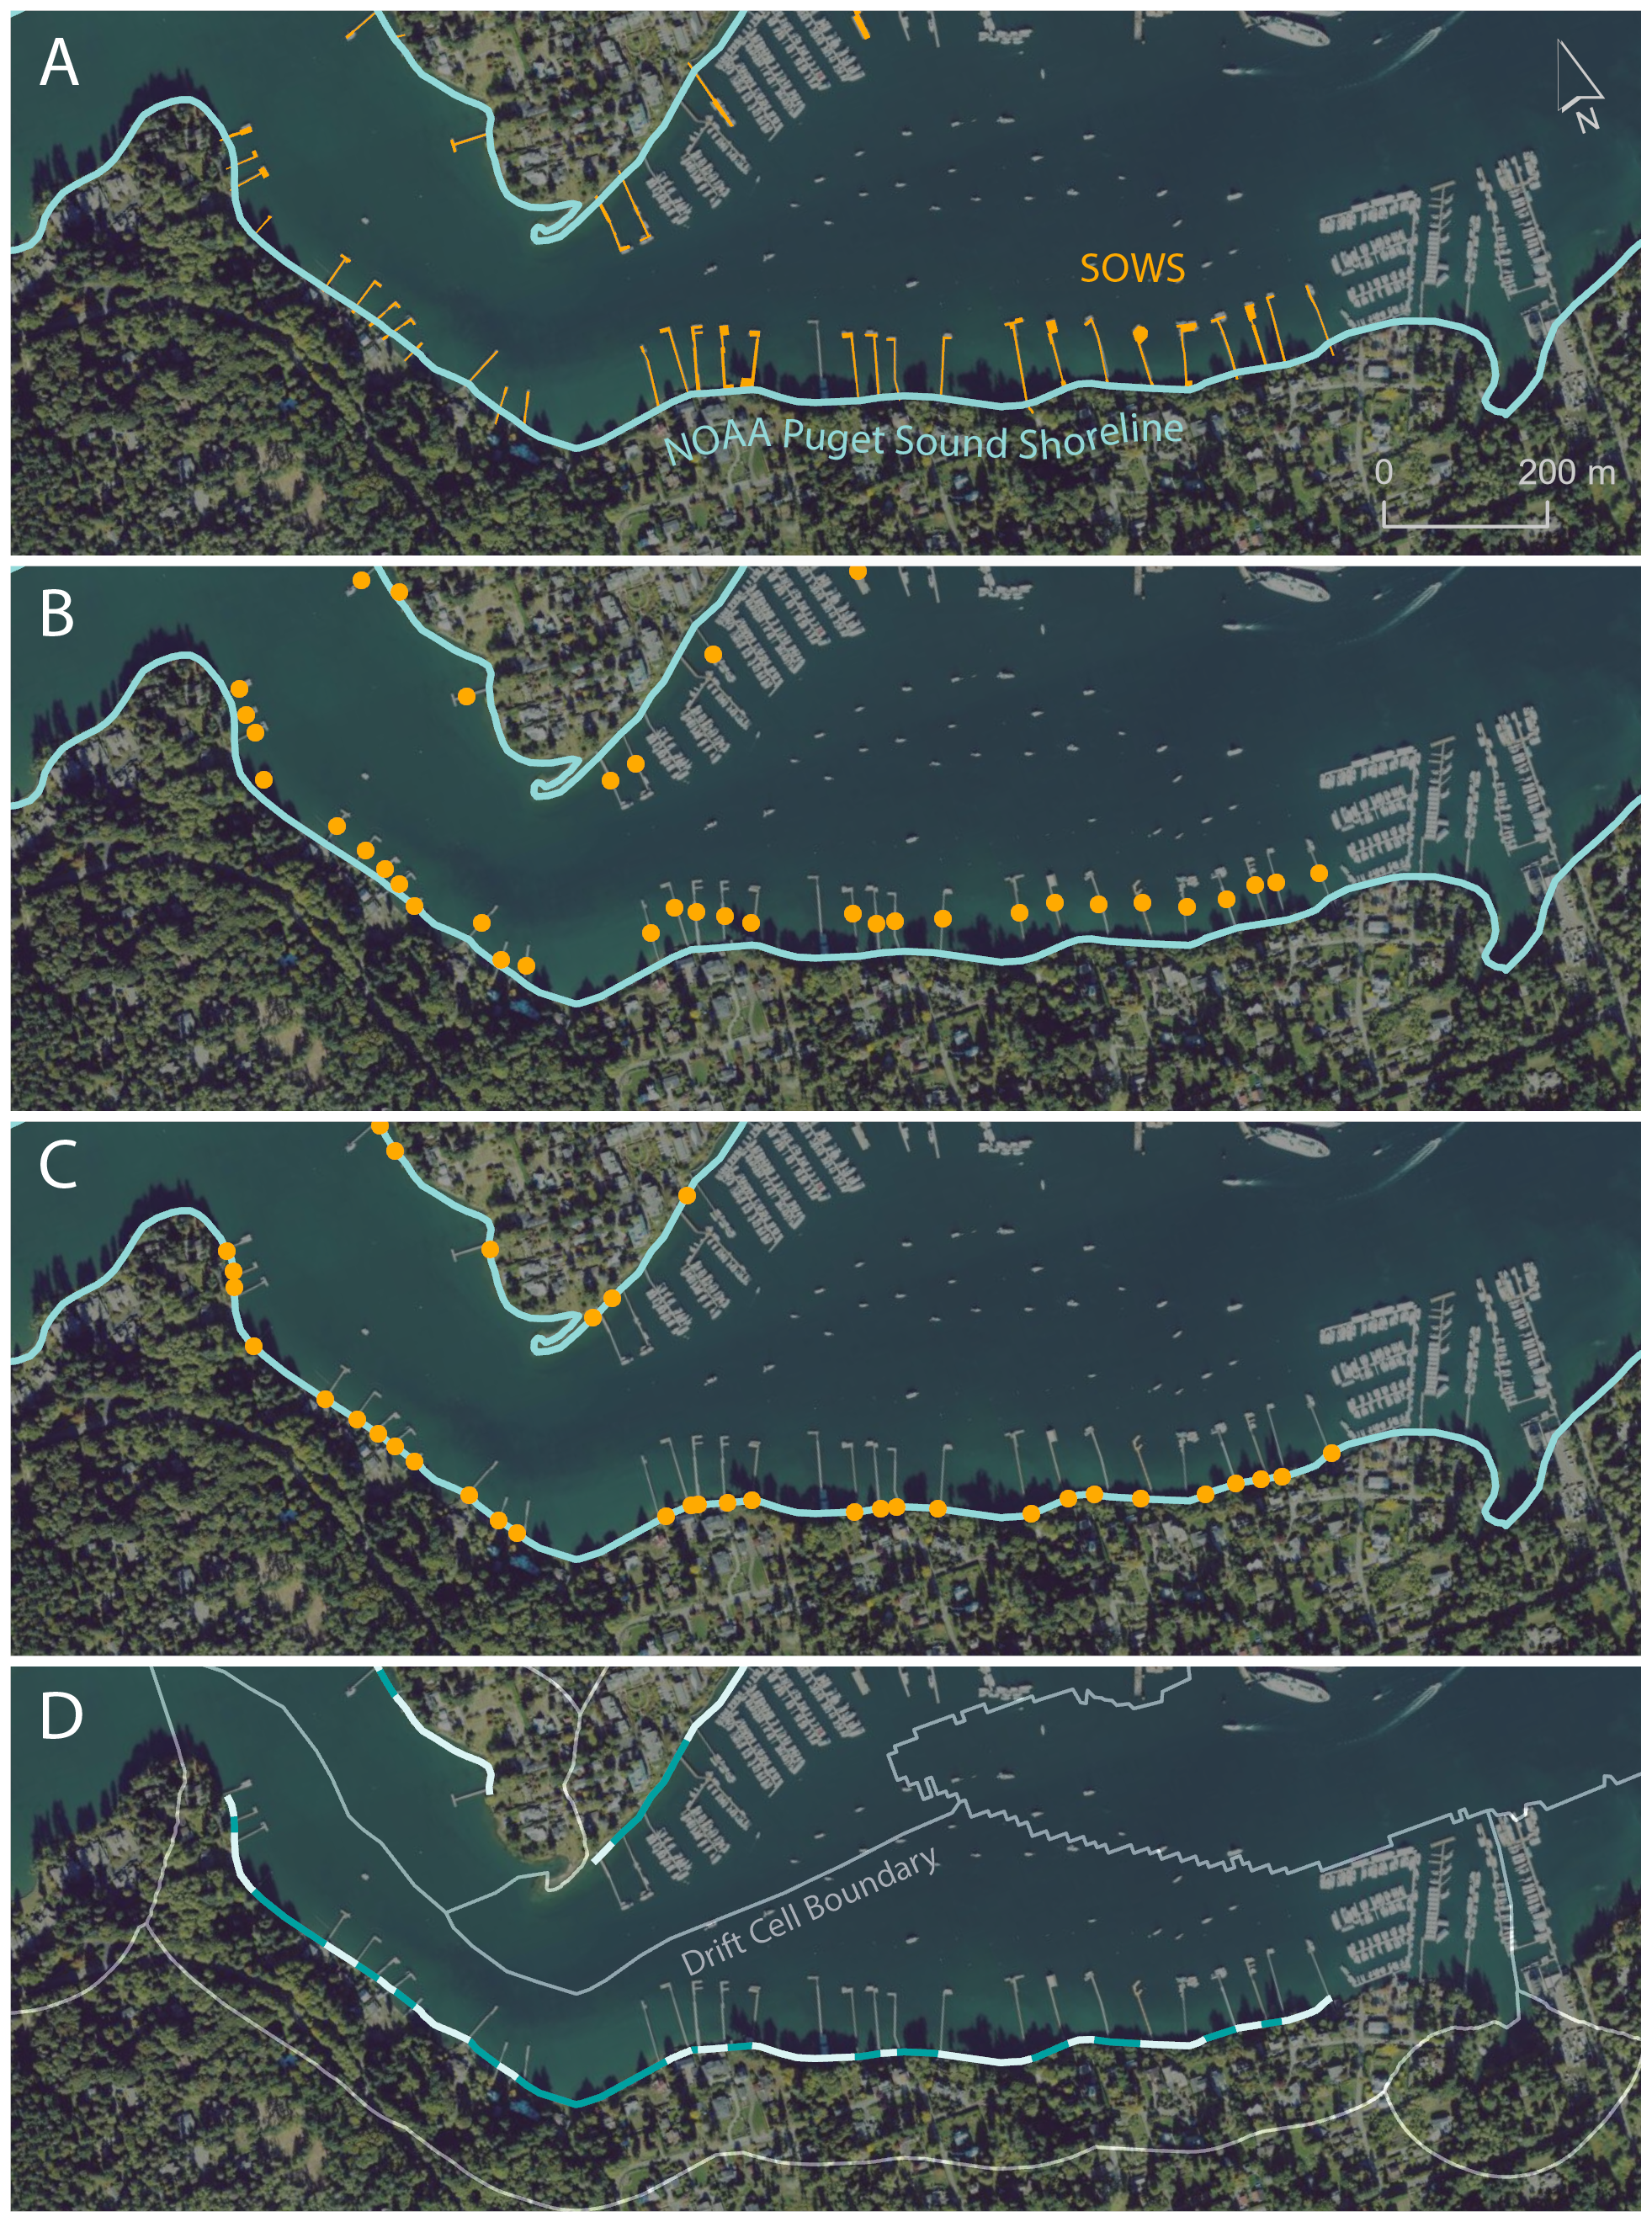
SOWS spacing analysis workflow example. A) SOWS polygons in orange and NOAA Puget Sound Shoreline (2018) in blue. B) SOWS centroids are generated. C) Centroids are snapped to the nearest shoreline edge. D) Shoreline is split at centroids into smaller line segments, shown in alternating light and dark blue. Only inner segments (those that do not cross summary polygon boundaries, Drift Cells in this example) are retained. Statistics are then calculated on the lengths of shoreline segments within each summary polygon.
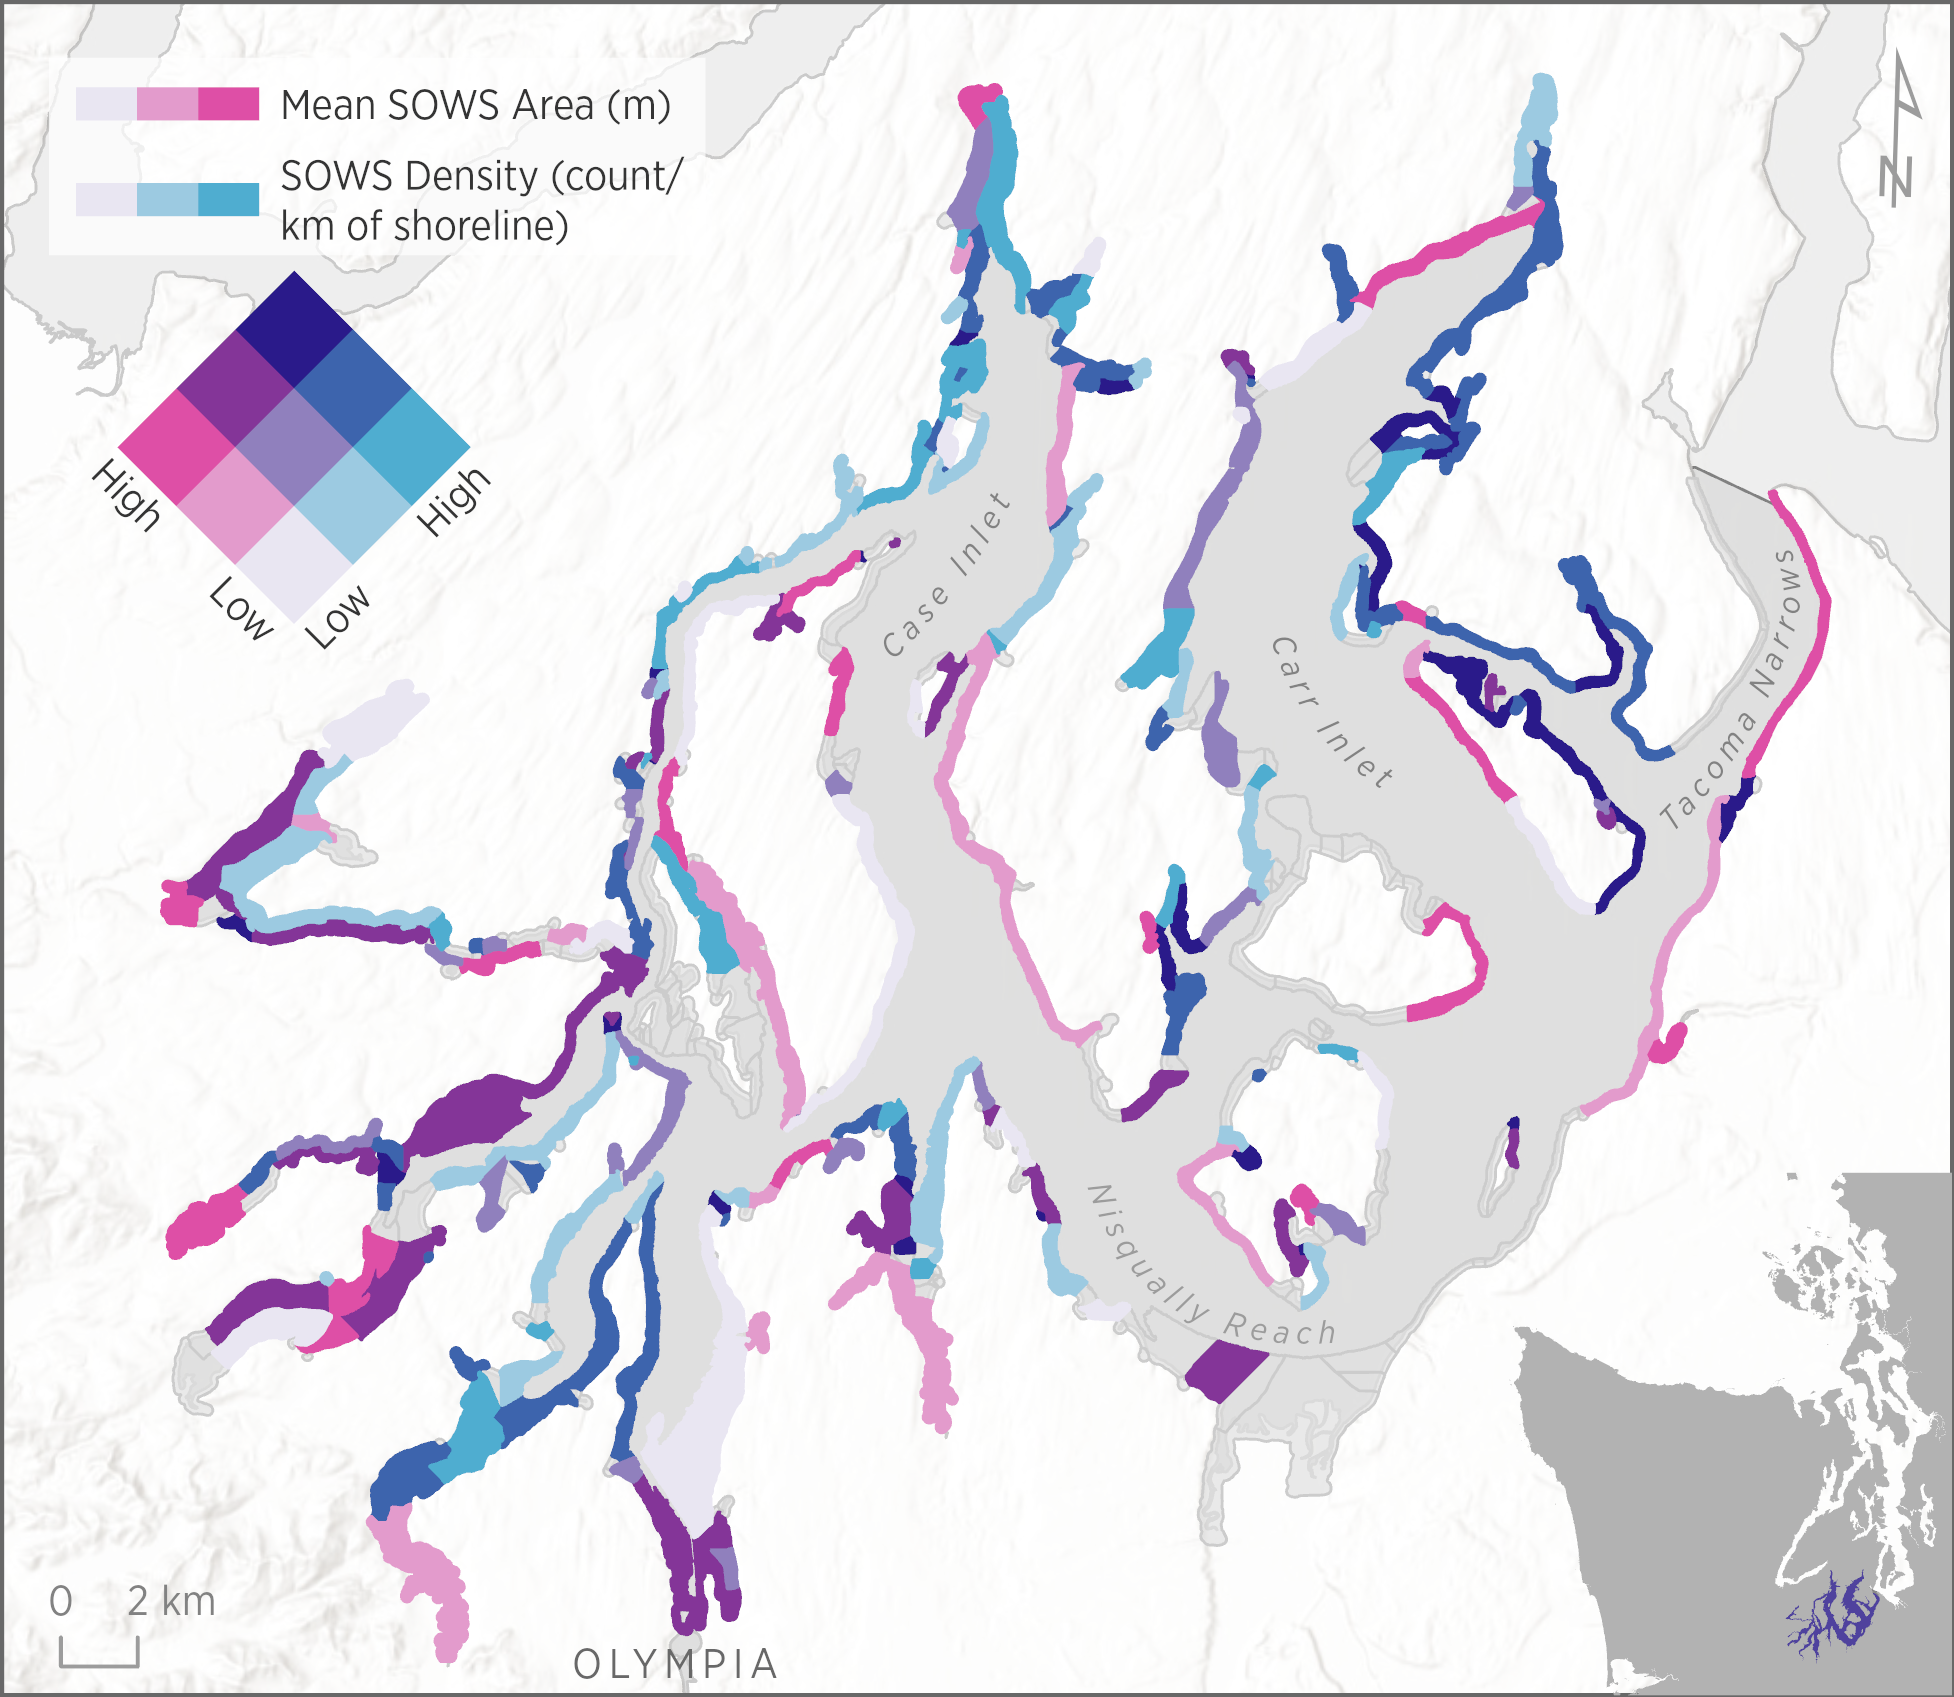
Bivariate visualization of SOWS Mean Area (pink) and SOWS Density (count per km of shoreline) (blue) for each Drift Cell in South Puget Sound. Drift Cells that contain SOWS with larger average sizes (Area) are shown with darker pink; Drift Cells with denser SOWS presence are darker blue; overlaps between these attributes are indicated by purple