
A DNR Nearshore Habitat Program Research Project
Mapping Seattle’s Historical Kelp Forests
Widespread losses of kelp forests in Puget Sound have sparked a collaborative conservation and recovery effort across the State of Washington. A major barrier to that work is a lack of historical baseline data on kelp forest distribution. We are still working understand exactly where and where these critical habitat losses have occurred so that we can effectively plan conservation, restoration, stewardship and management efforts.
In my role at WA DNR Nearshore Habitat Program, I work on filling critical data gaps in kelp forest spatiotemporal distribution. One way to fill those gaps is to evaluate historical imagery. In this project, I analyzed a collection of 35mm slides for kelp forest presence and compared the results to recent survey data. The results showed previously undocumented kelp forests losses around Seattle shorelines. To communicate these findings, I created an interactive StoryMap and put together a detailed technical report, viewable below.
View some selected maps that I created for the print report below. Click an image to enlarge.
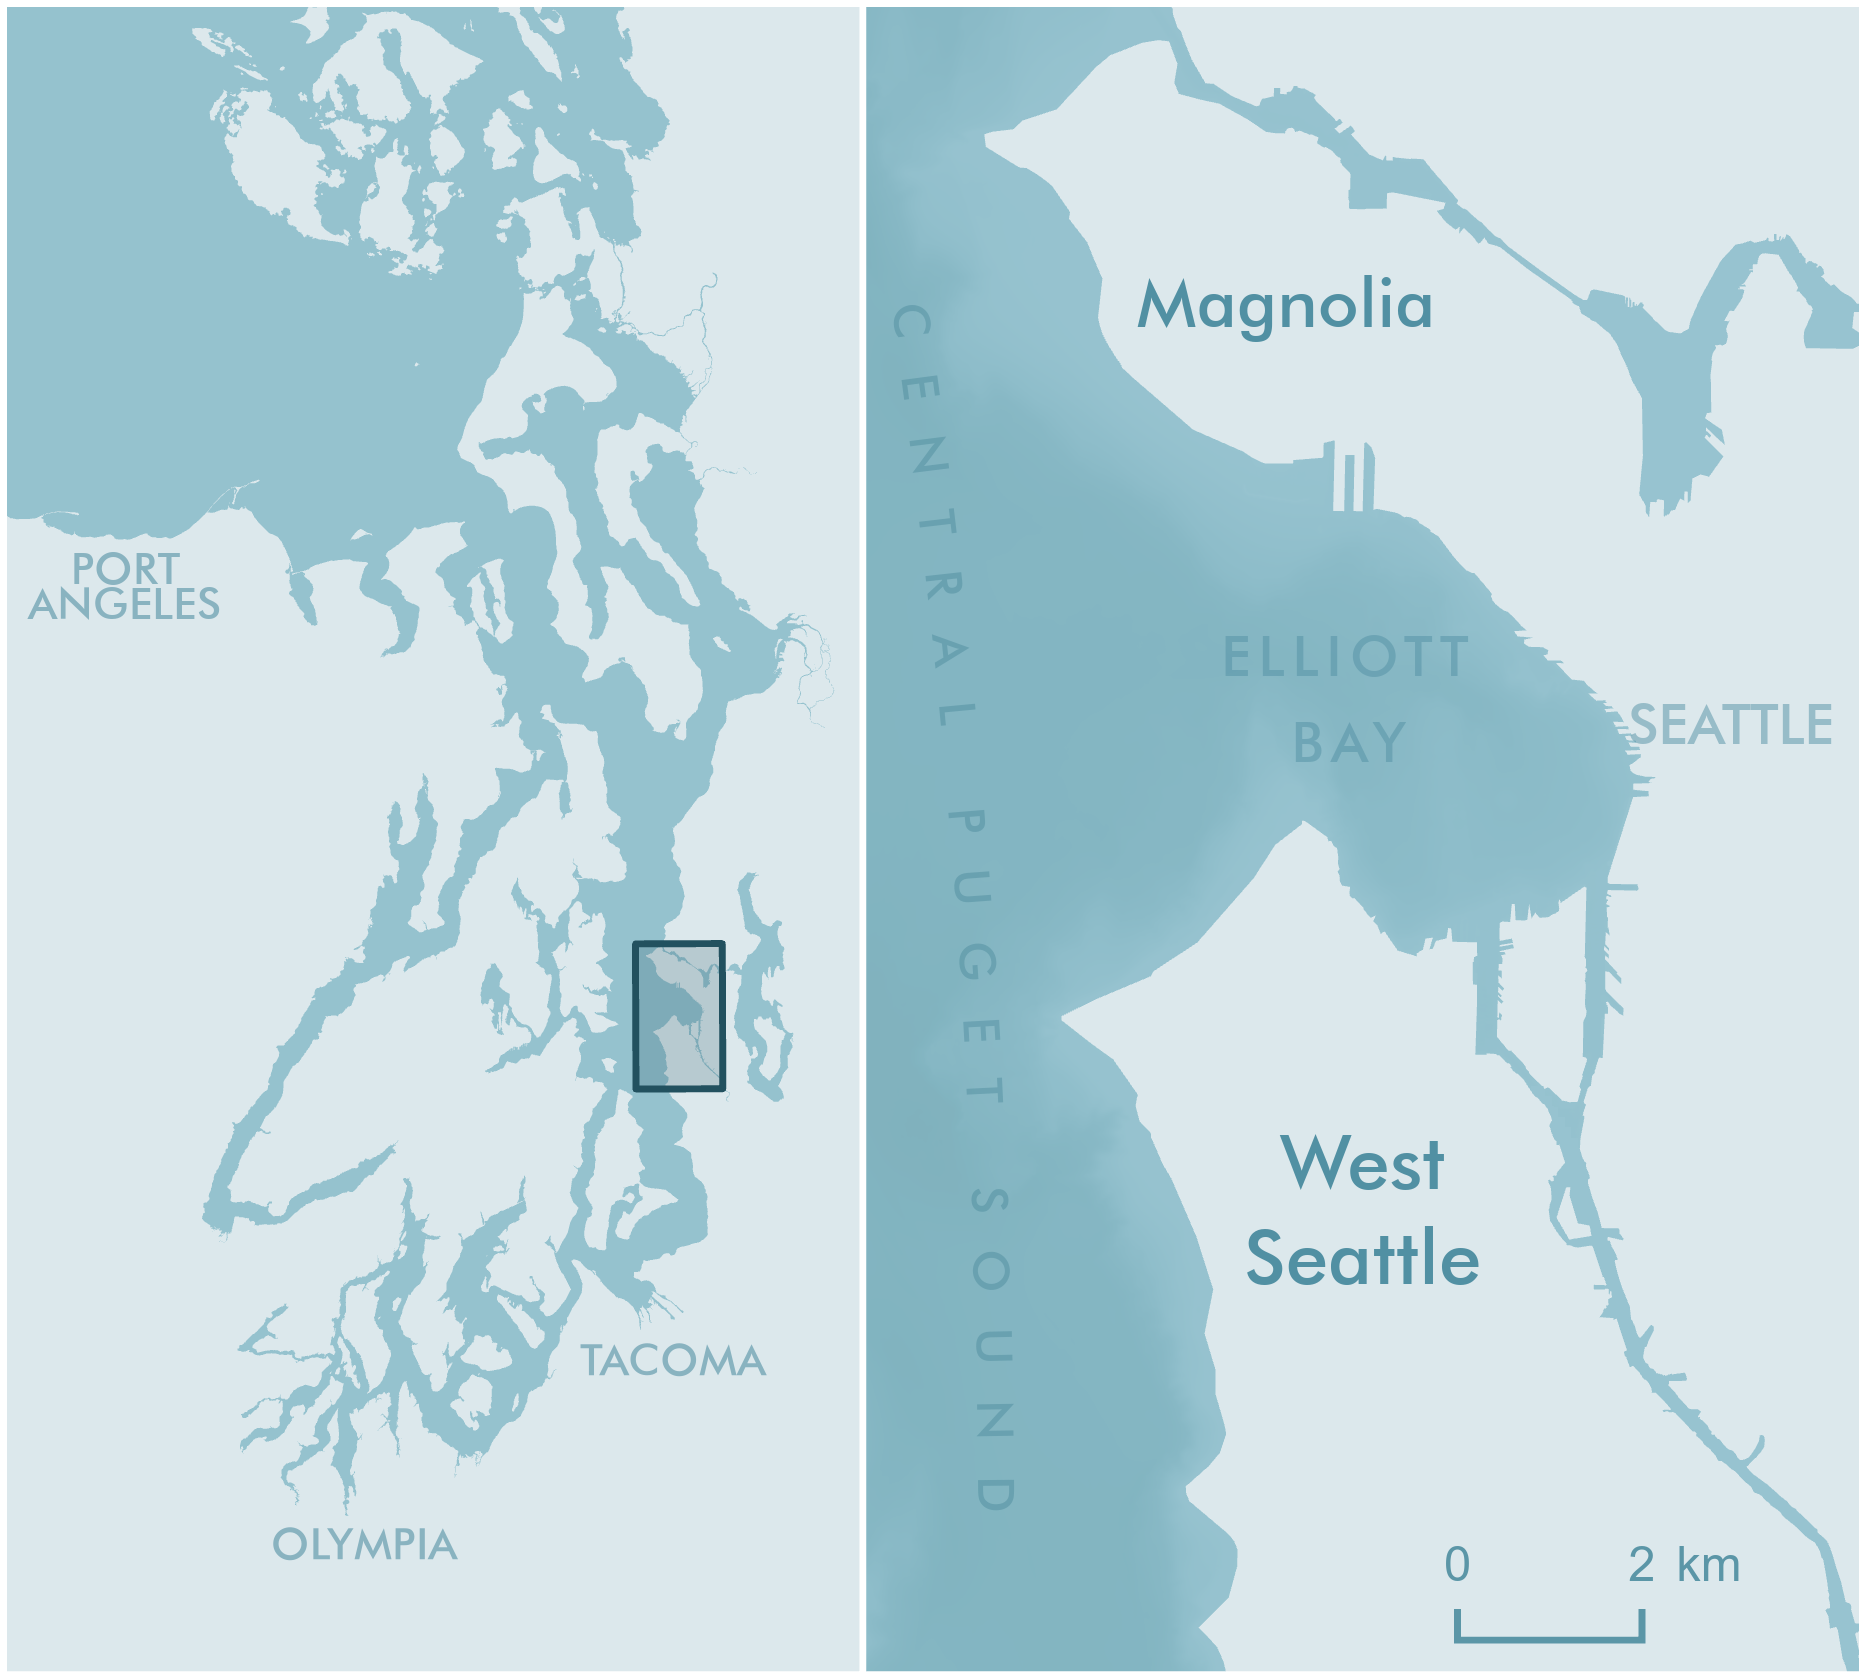
Figure 2. Maps showing the location of Magnolia and West Seattle, the general area where the 1984 images were captured, in Central Puget Sound near Seattle, WA.
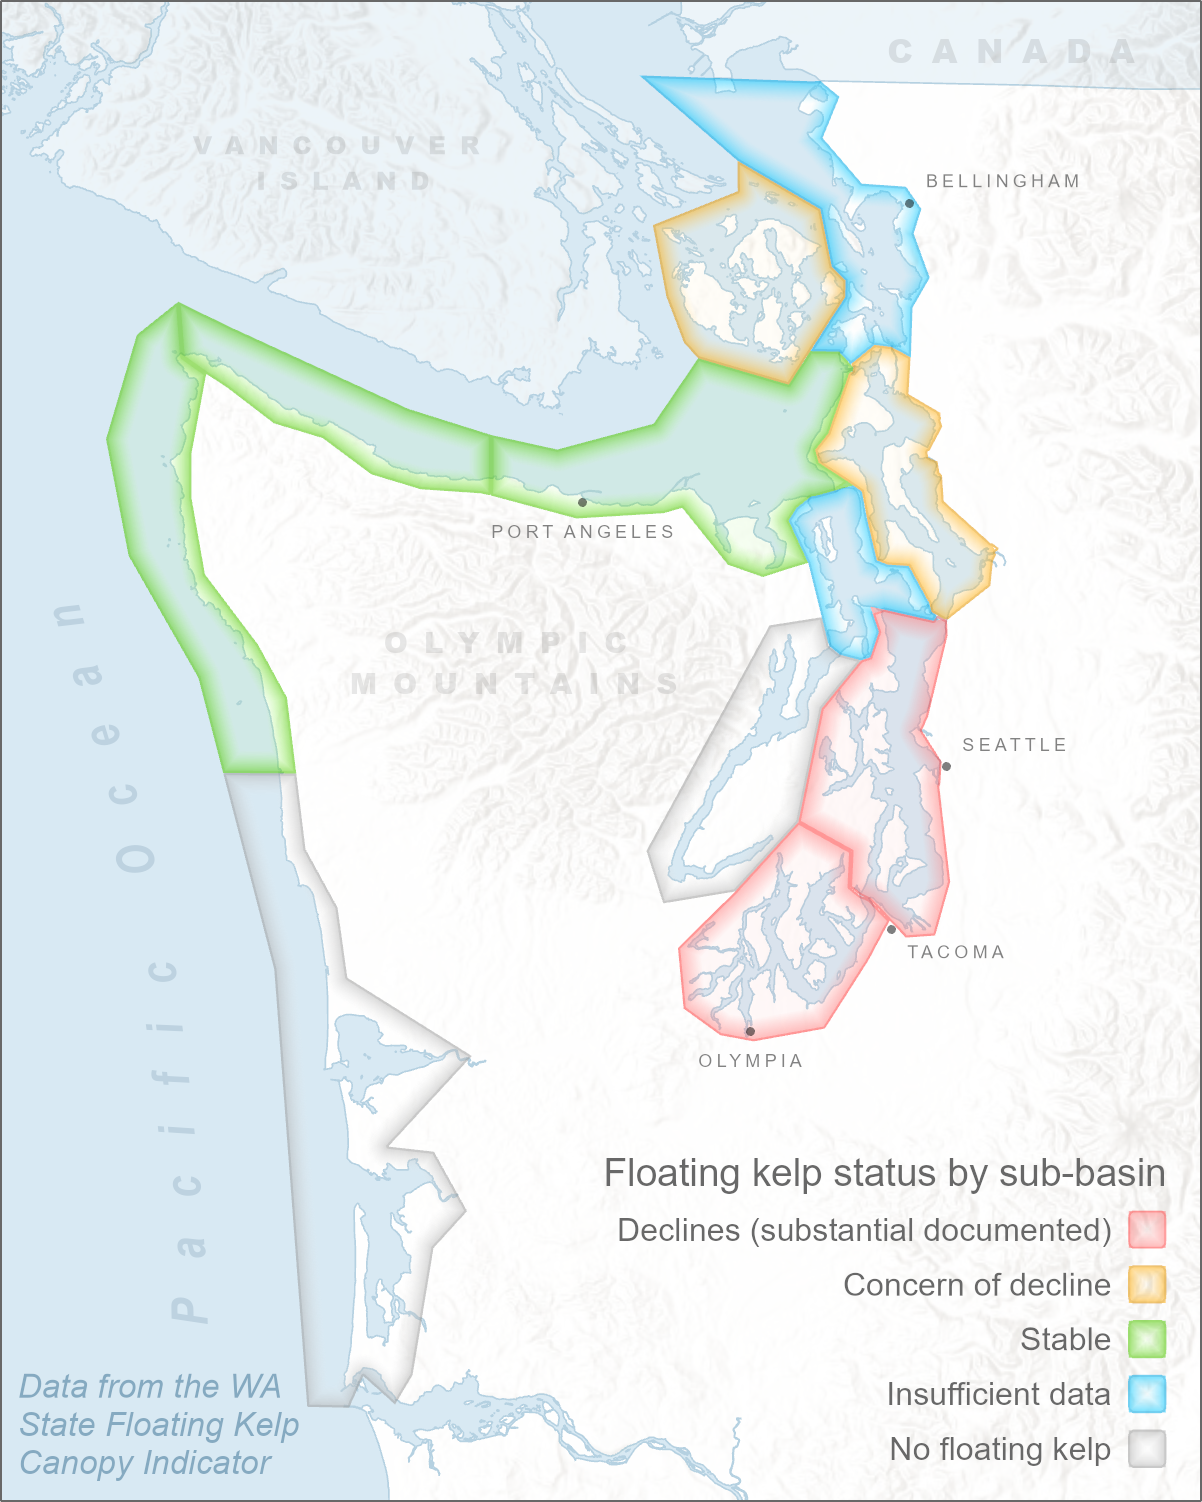
Figure 1. Floating kelp status of each sub-basin in Washington State, as described in the WA State Floating Kelp Bed Area Vital Sign Indicator.
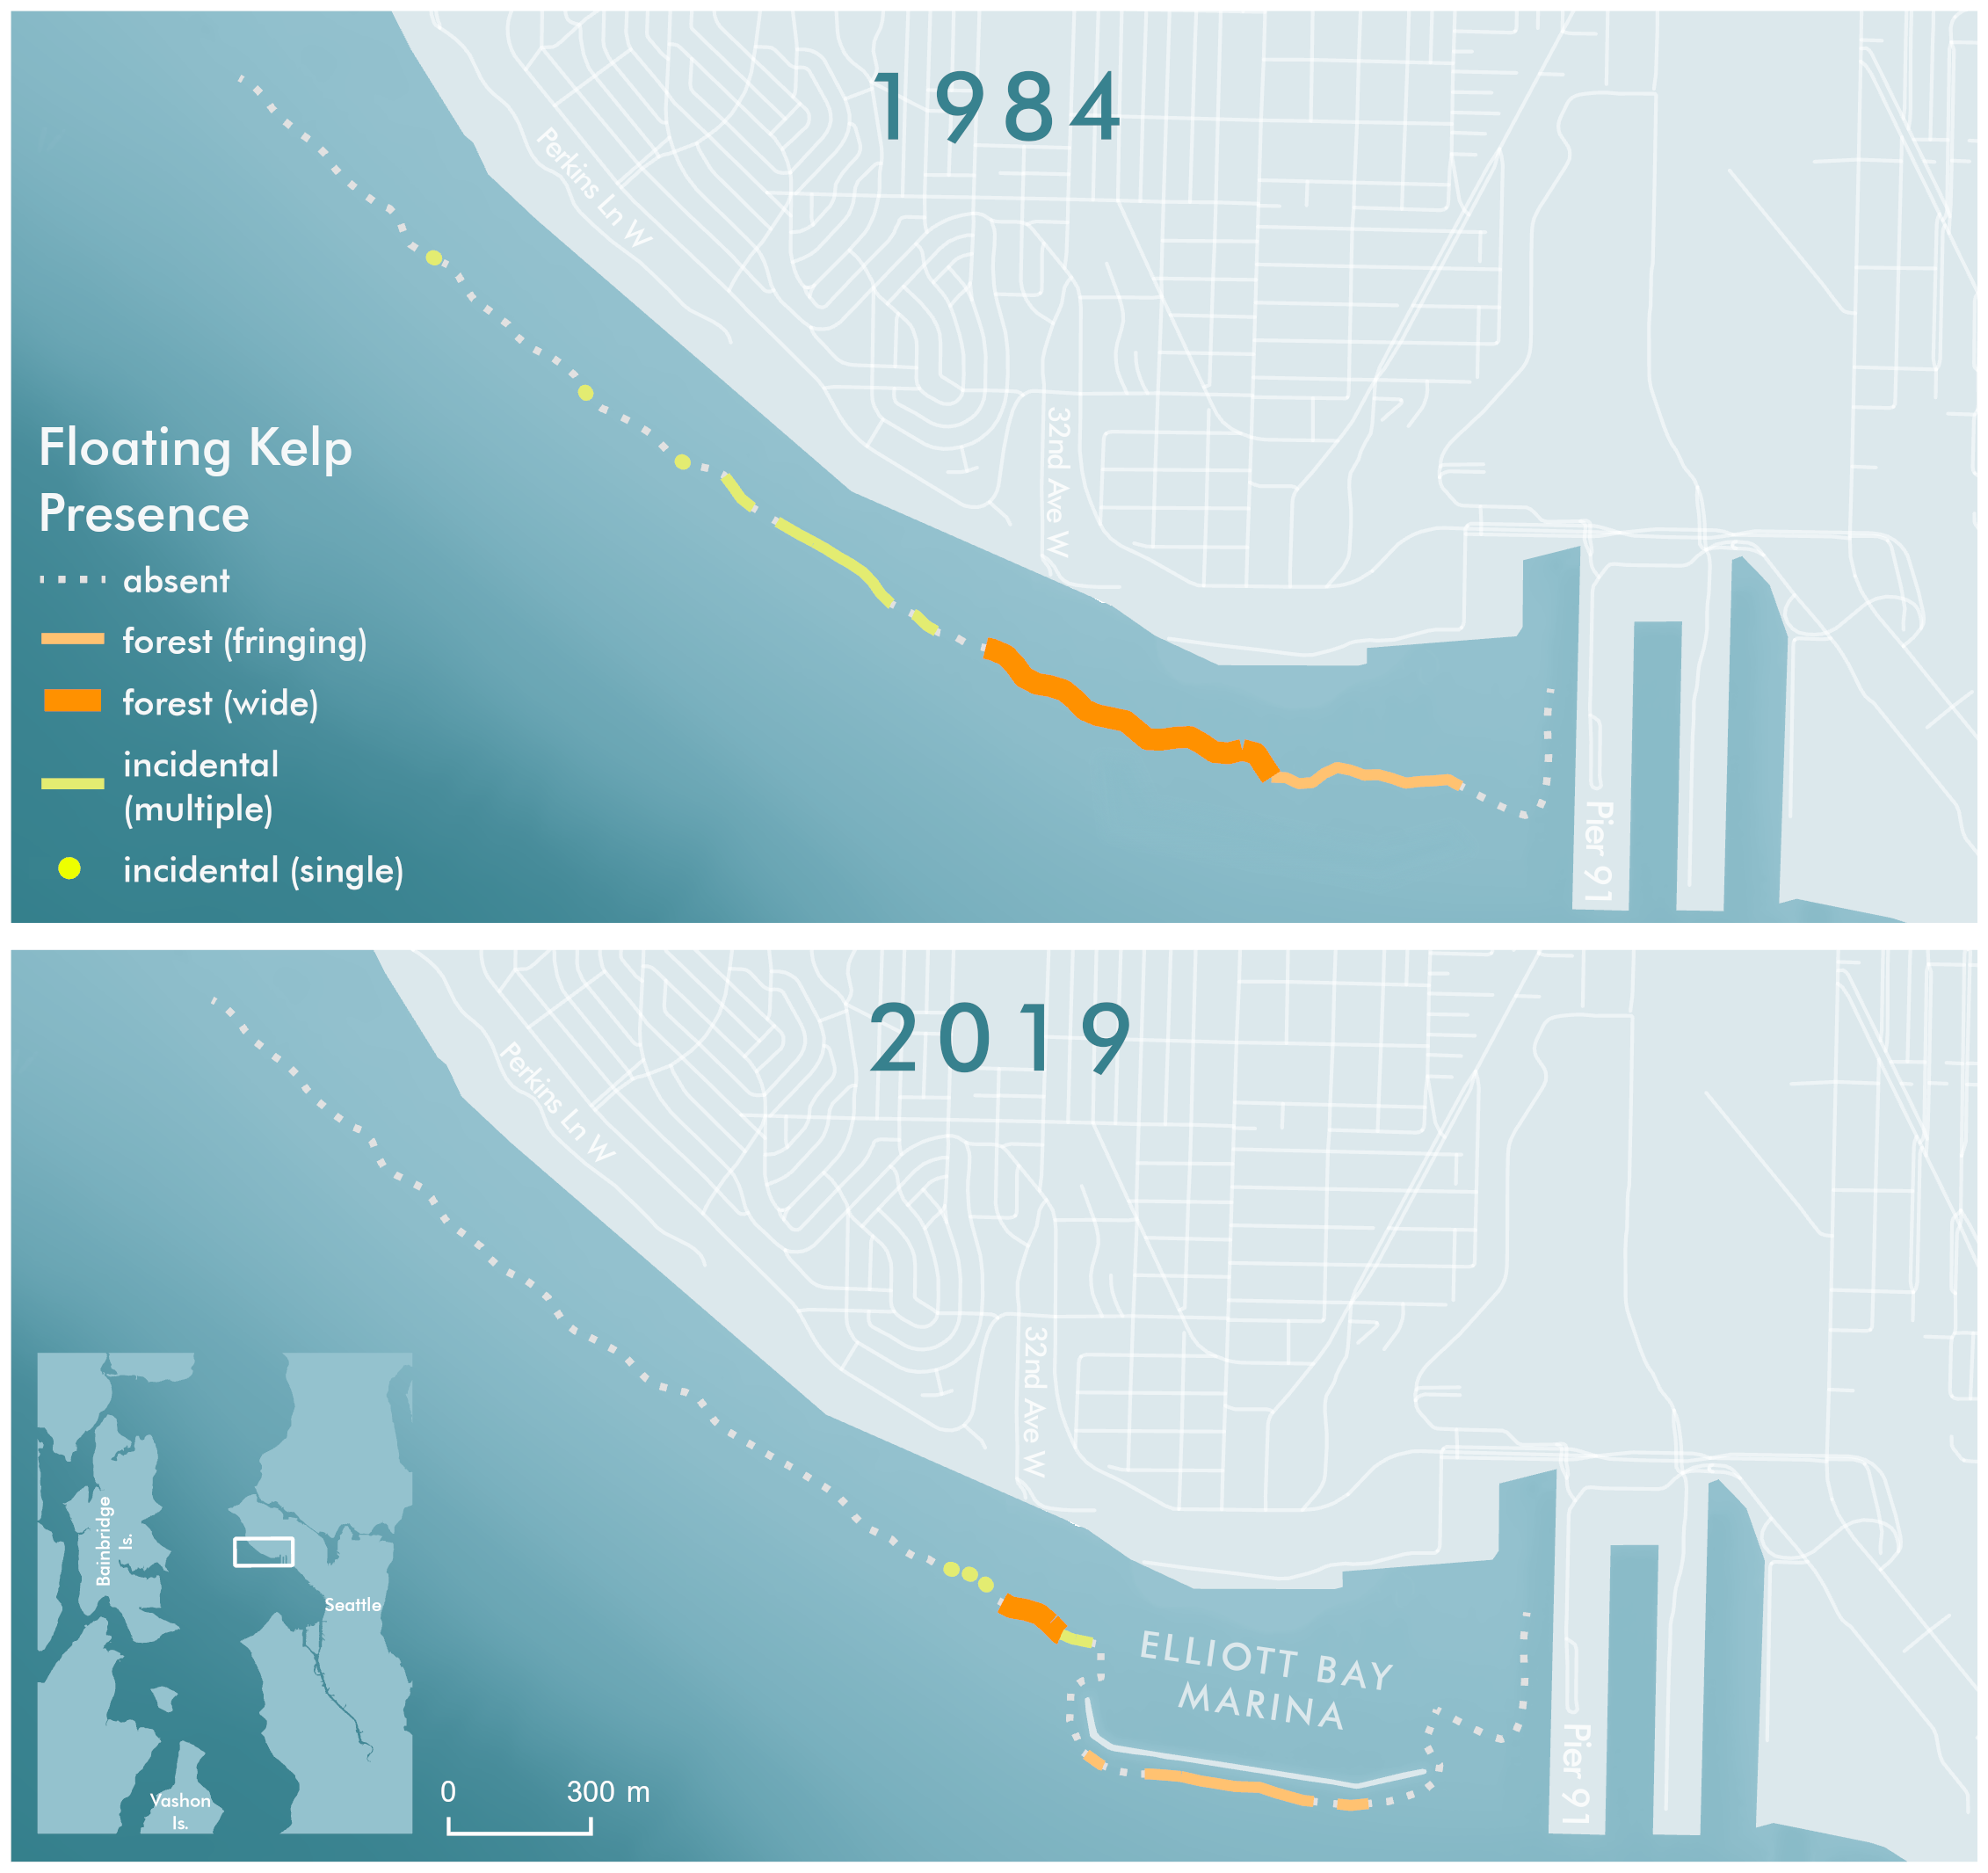
Figure 12. Maps of linear extent of floating kelp along Magnolia in 1984 derived from aerial imagery (top) and 2019 derived from boat-based linear extent mapping (bottom). Floating kelp presence is symbolized by type/subtype: dotted grey = absent, wide orange line = forest (wide), narrow orange line = forest (fringing), yellow line = incidental (multiple), yellow dot = incidental (single). See Table 1 for category definitions.

Figure 13. Floating kelp presence in West Seattle and Lincoln Park in 1984 derived from aerial imagery (left) and 2019 derived from boat-based linear extent mapping (right). Floating kelp presence is symbolized by type/subtype: dotted grey = absent, wide orange line = forest (wide), narrow orange line = forest (fringing). Highlighted areas show areas surveyed by both datasets; kelp presence is not reported in this study in darkened areas, although 2019 dataset covers entire shoreline. See Table 1 for category definitions.

Figure 8. Generalized footprint of 1984 aerial imagery (orange) of floating kelp beds in the vicinity of Seattle, WA, as determined by matching notable shoreline features present in historical imagery (1984) with modern reference orthoimagery datasets (2010 & 2019).

Figure 10. Photographs of Lincoln Park, in Fauntleroy Cove. Images are approximately aligned with their location on shore but are not transformed/orthorectified relative to the ground. Underlying imagery is 2019 NAIP Natural Color Imagery Basemap (Esri, USDA Farm Service Agency).

Figure 9. Images (1984) of Magnolia Bluff from Smith Cove to 32nd Ave. Images have been rotated, scaled, and placed to align approximately with the shoreline, but have not been transformed or rectified. Underlying imagery is 2019 NAIP Natural Color Imagery Basemap (Esri, USDA Farm Service Agency).